History and Statistic view
The History and Statistic view of engine analysis provides the following information in Analysis Explorer:
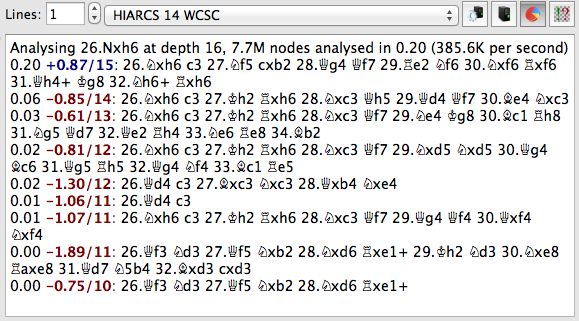
- Current status of the engine, this shows what move it is analysing, the depth of analysis, number of nodes (positions) it has analysed so far and the time it has taken. Finally the average number of positions it has analysed per second is given. It will also show the number of accesses to the local endgame tablebases by the engine in its search.
- The history of analysis given by the engine is given in reverse order so the latest line is always top of the list. At each depth searched the engine analysis is given and also if it changed its mind about which move was best. The most recent evaluation is always at the top of the list of analysis lines.
Analysis lines from the engine are given in this order (left to right):
- Time - the time at which the engine output the analysis. We observe FIDE time format of hours:mins.secs, hours are omitted where appropriate.
- Evaluation in pawns. A positive value is in favour of White and shown in blue, a negative value is in favour of Black and shown in red. For example +1.00 would indicate White is the equivalent of 1 pawn ahead.
- Depth of search. This is the depth in half-moves or plies that the engine has searched to. The deeper an engine searches the better its analysis result usually is.
- Principle line - This is the expected line of play the engine expects to occur with best play.
You can insert the evaluation, depth and best line of play into the Game Notation by simply clicking the evaluation and depth value (in blue or red). Here is an example:

You can also copy the best line or all the history of analysis to the clipboard by right clicking on the analysis pane you get this pop up menu:
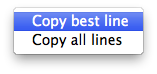
Any analysis lines copied are copied with piece letters. When all analysis lines are copied the analysis is detailed in time order with the latest line at the bottom.